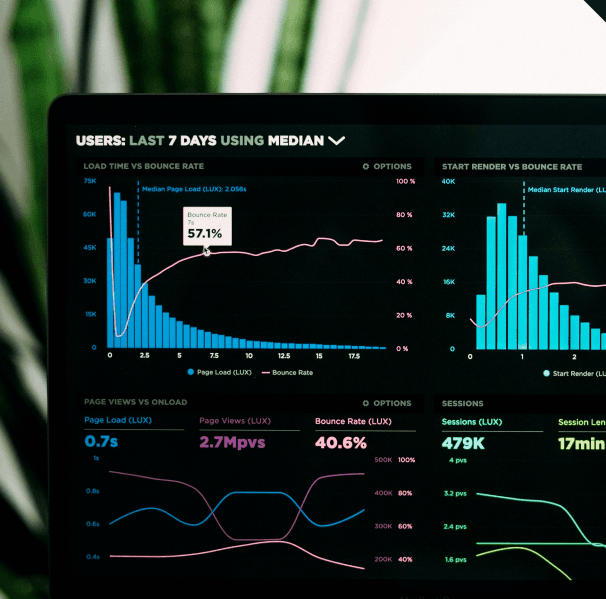
Custom Executive & Operational Dashboards
Design high-impact, real-time visual dashboards (Tailwind UI, React, Power BI, Tableau, Looker) tailored specifically for executive leadership, product teams, and revenue operations.
Transform scattered business metrics into actionable real-time insights. We architect, engineer, and deploy custom business intelligence (BI) dashboards and executive data portals that centralize your metrics, streamline reporting, and accelerate data-driven decision-making.
From automated data pipeline integration to interactive, high-speed visualization interfaces, our intelligence systems turn complex data noise into strategic operational clarity.
Design high-impact, real-time visual dashboards (Tailwind UI, React, Power BI, Tableau, Looker) tailored specifically for executive leadership, product teams, and revenue operations.
Consolidate siloed data from CRMs, ERPs, payment gateways, and web analytics into centralized cloud warehouses (Snowflake, BigQuery, PostgreSQL) with automated ETL/ELT pipelines.
Architect low-latency streaming architectures (Kafka, WebSockets) to display live transactional data, server metrics, and operational performance without page reloads.
Integrate statistical models and machine learning forecasting directly into dashboard interfaces to visualize revenue trends, inventory demand, and customer retention metrics.
Build secure, white-labeled embedded analytics features into your SaaS applications or client portals, empowering end-users with interactive data exploration.
Implement strict row-level and column-level security protocols to ensure teams access only the data metrics permitted by their security clearance.
Managing operations across multiple disconnected software tools delays critical business decisions and increases human reporting errors. A custom intelligence dashboard unifies all your key performance metrics in one central, auto-refreshing command center.
Simplified complex data visualization and streamlined user onboarding, boosting 30-day retention by 35%.
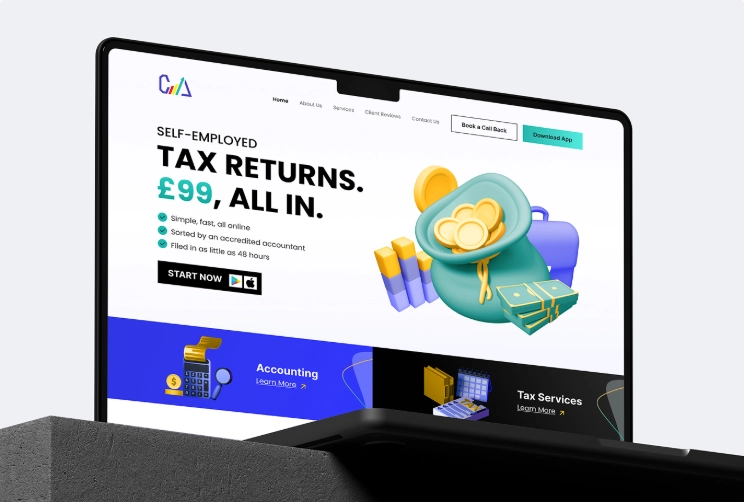
We transformed CAL Accountants from a traditional consultancy into a digital-first leader by delivering a comprehensive end-to-end ecosystem. This integrated solution featured a fresh brand identity, a conversion-driven website, and a powerful CRM coupled with a customer-facing mobile app that automates the entire tax submission and payment process.
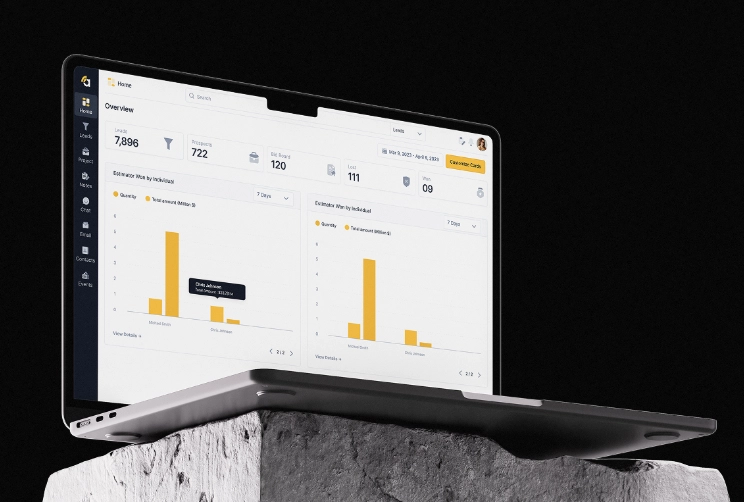
Amplify is a complete redesign of a construction project management platform, covering the website, web app, and mobile app. The project transformed an outdated, confusing system into a clean, modern, and intuitive SaaS experience by fixing broken user flows, redesigning all features, adding missing functionality.
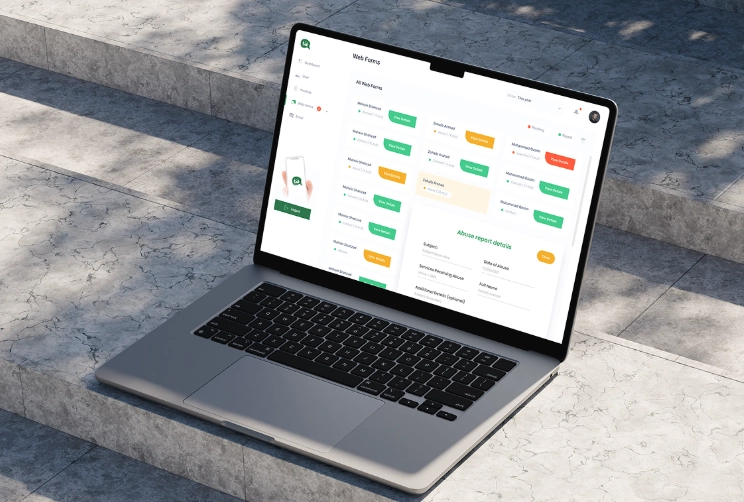
We transformed Talk Asia into a seamless SaaS communication platform by designing a custom web application from scratch. This integrated digital solution features an intuitive user interface, streamlined messaging workflows, and a conversion-focused design system crafted to scale team collaboration and enhance real-time engagement.

Designed and architected an advanced Marketplace Builder module that allows businesses to create and customize their own storefronts inside the PayEver SaaS ecosystem. The module includes a drag-and-drop page editor, layered page management system, customizable components, and full integration with the platform’s existing e-commerce inventory and business tools.
Our structured engineering workflow balances visual UX clarity, database query speed, and data accuracy across your entire platform.
Step 01
We identify core business objectives, map essential KPIs across leadership roles, and audit raw data sources for cleanliness and readiness.
Step 02
We construct automated ETL/ELT data pipelines, structure dimensional data models, and optimize database indexing for high-speed queries.
Step 03
We design clean, intuitive interface mockups, establishing clear visual hierarchy, color coding, and interactive filter controls.
Step 04
We code responsive dashboard components using modern frontend libraries, connecting them directly to live database endpoints.
Step 05
We verify calculation accuracy across all data cards, enforce security protocols, and deploy your live intelligence portal with automated refresh cycles.
Eliminate static spreadsheets and delayed weekly reporting. We build lightning-fast interactive dashboards engineered with intuitive visual hierarchy, ensuring non-technical stakeholders instantly understand critical performance metrics.
Key Deliverables: