Data Visualization & Analytics UI
Turn complex data matrices into clear, customizable charts, visual graphs, and dynamic metric cards designed for instant comprehension.
Transform dense data streams into actionable, user-centric insights. We design intuitive SaaS dashboards and complex Web app interfaces that reduce cognitive load, accelerate user onboarding, and keep subscribers active daily.
Whether you are building a multi-tenant B2B SaaS platform or modernizing an internal analytics suite, our dashboard design services align user workflows with your core SaaS metrics.
Turn complex data matrices into clear, customizable charts, visual graphs, and dynamic metric cards designed for instant comprehension.
Tailor interface layouts, administrative permissions, and navigation views for different user roles—from high-level executive summaries to deep operational views.
Design frictionless product onboarding sequences, empty states, tooltip tours, and setup checklists that drive early product adoption.
Craft powerful, responsive data tables featuring global search, multi-parameter filtering, inline editing, bulk actions, and pagination.
Engineering adaptive UI component libraries supporting seamless switching between Light and Dark modes to reduce eye fatigue during prolonged use.
Optimize interface patterns for large datasets, real-time streaming notifications, lazy loading, and quick-action global search bars.
Clunky dashboards cause user churn, high customer support costs, and low daily active usage. A sleek, intuitive dashboard architecture turns complex tools into daily essential habits for your enterprise users.
Simplified complex data visualization and streamlined user onboarding, boosting 30-day retention by 35%.
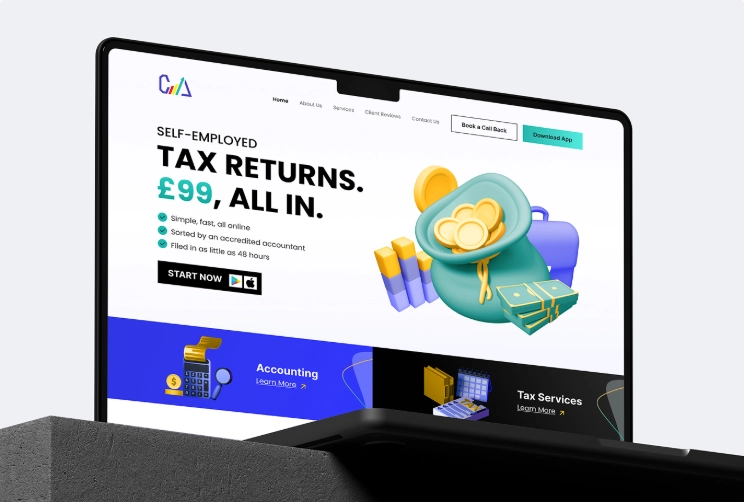
We transformed CAL Accountants from a traditional consultancy into a digital-first leader by delivering a comprehensive end-to-end ecosystem. This integrated solution featured a fresh brand identity, a conversion-driven website, and a powerful CRM coupled with a customer-facing mobile app that automates the entire tax submission and payment process.
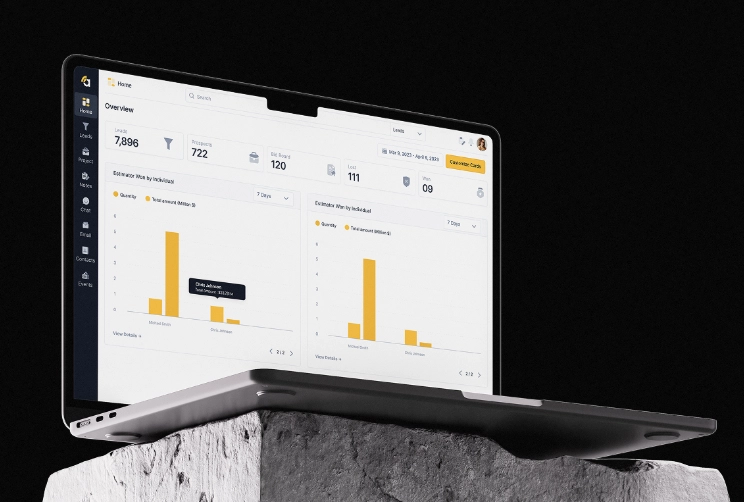
Amplify is a complete redesign of a construction project management platform, covering the website, web app, and mobile app. The project transformed an outdated, confusing system into a clean, modern, and intuitive SaaS experience by fixing broken user flows, redesigning all features, adding missing functionality.
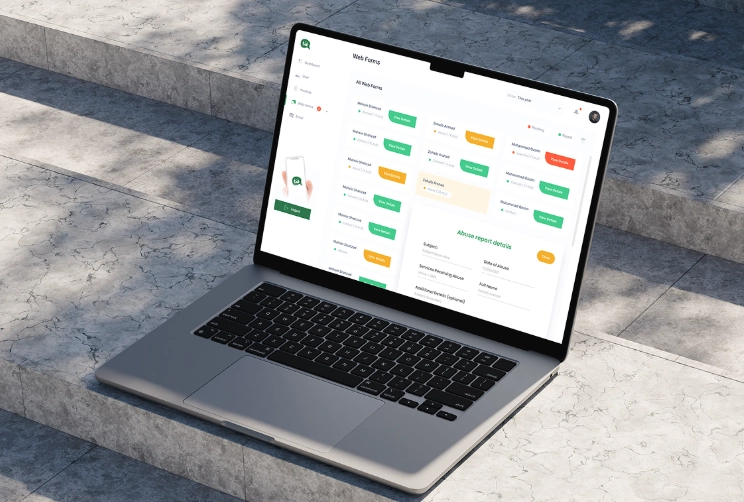
We transformed Talk Asia into a seamless SaaS communication platform by designing a custom web application from scratch. This integrated digital solution features an intuitive user interface, streamlined messaging workflows, and a conversion-focused design system crafted to scale team collaboration and enhance real-time engagement.
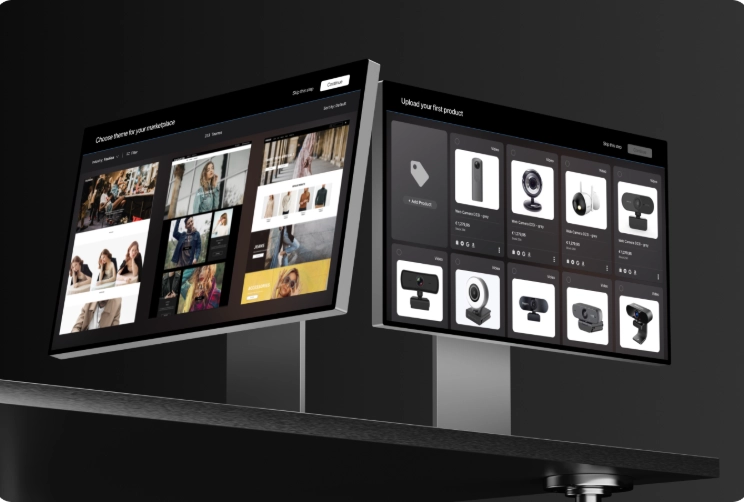
Designed and architected an advanced Marketplace Builder module that allows businesses to create and customize their own storefronts inside the PayEver SaaS ecosystem. The module includes a drag-and-drop page editor, layered page management system, customizable components, and full integration with the platform’s existing e-commerce inventory and business tools.
Our structured design workflow balances data density, speed, and ease of navigation at every step.
Step 01
We map out primary user personas, key operational tasks, and essential metrics needed across different authorization levels.
Step 02
We create flexible dashboard layout grids that prioritize critical data points and define logical widget placement.
Step 03
We apply visual hierarchy, consistent color semantics, accessible charts, and modern micro-interactions to clear up visual noise.
Step 04
We build clickable prototypes showcasing real data states, dropdown filters, modal drawers, and error handling for user feedback.
Step 05
We deliver organized Figma tokens, design specs, and component specs for popular web UI frameworks (React, Vue, Tailwind).
Eliminate interface clutter in complex software. We structure high-density SaaS workflows so power users can monitor KPIs, run reports, and execute daily operations with zero friction.
Key Deliverables: